Overview
In this article we discuss the statistical distribution of metal film and carbon film resistors over a 500-unit sample.
Table of Contents
Background
In this experiment 1000 total resistors were purchased from an electronics supplier. Each of the resistors were produced from the same company with 500 of them being Metal Film, and another 500 being Carbon Film. These were then measured using a Keithley DMM6500 multimeter after the DMM had idled for a period of 1 hour to ensure it was up to proper operating temperature.
| Type | Part Number | Nominal Resistance | Power Rating | Tolerance |
|---|---|---|---|---|
| Metal Film | MFR-25FRE52-1K | 1000Ω | 0.25W | 1% |
| Carbon Film | CFR-50JR-52-1K | 1000Ω | 0.5W | 5% |
Testing Procedure
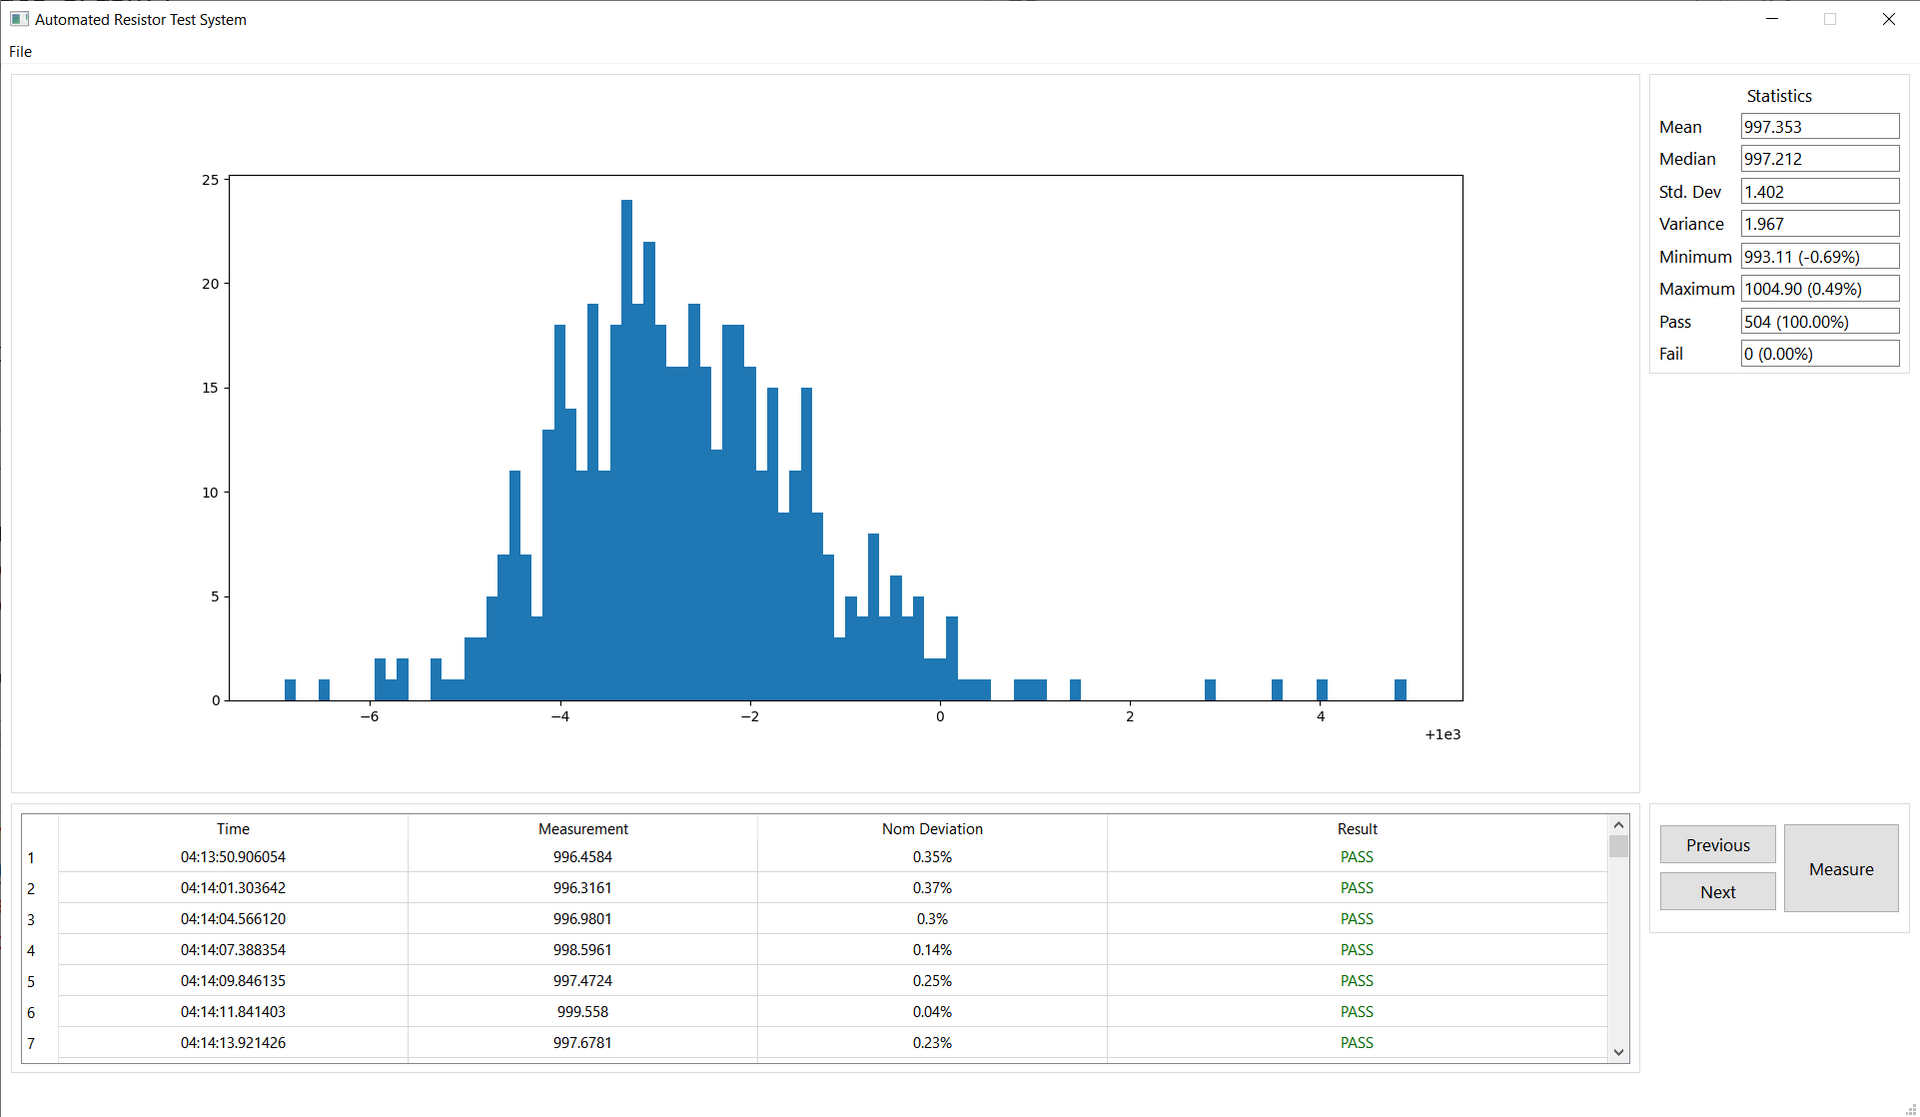
Custom software was developed for this project using the Qt GUI framework and the matplotlib graphing library. The Keithly DMM6500 was connected to the computer via USB and the measurements were activated using a foot pedal for hands free operation.
Hook type leads were used for the measurement probes. Ideally kelvin 4-wire probes would have been used, however, the resistance of the leads when shorted was found to be \(<200\ mΩ\). Given that the nominal resistance of these resistors is 1000Ω the additional resistance due to the probes can be neglected. Ambient temperature was measured at 19.7°C but was not controlled.
Note
In laboratory conditions additional sources of error could include probe positioning (lead length variation), as well as ambient temperature and thermal gradients at dissimilar metal junctions. This test should not be considered analytical in nature since not all of these conditions were controlled.
Results
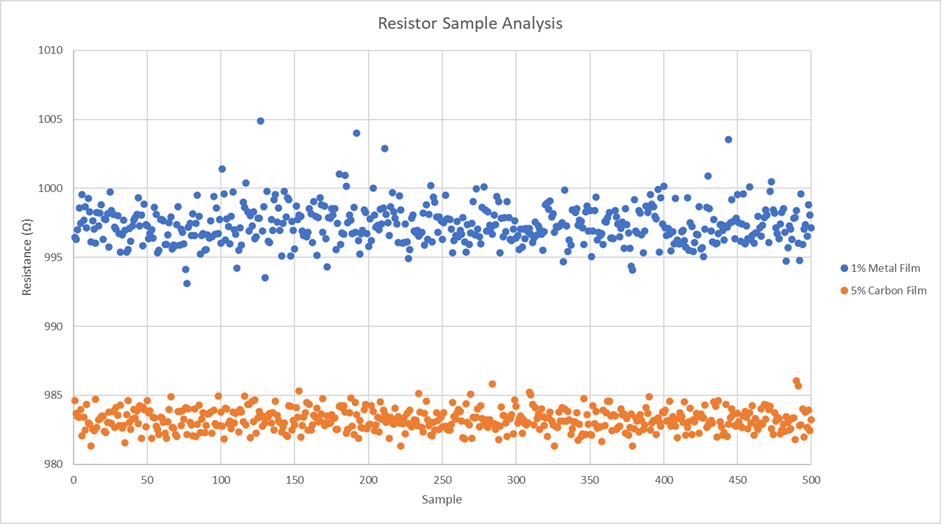
The results of this test were unexpected. Of particular note is that the results suggest the 5% tolerance resistors have a significantly smaller variance than the 1% metal film. Note that all of the resistors were still within the manufacturer’s specified tolerance, however.
Another observation is that the distribution is essentially gaussian with what appears to be a small amount of skew. This is in contrast to a bimodal distribution which was anticipated with the 5% resistors. Some manufacturers for may remove the resistors within the 1% tolerance band and resell them for a higher price leaving you with a bimodal distribution of resistors. This was not observed in this sample.
Statistical Summary
| Parameter | Metal Film | Carbon Film |
|---|---|---|
| Tolerance | 1% | 5% |
| Std Dev | 1.404 | 0.781 |
| Variance | 1.971 | 0.609 |
| Minimum | 993.106 | 981.307 |
| Maximum | 1004.905 | 986.040 |
| Median | 997.213 | 983.169 |
| Mean | 997.353 | 983.223 |
| Samples | 504 | 502 |
| Nominal | 1000 | 1000 |
| Deviation Min | -0.69% | -1.87% |
| Deviation Max | 0.49% | -1.40% |
| Deviation Range | 1.18% | 0.47% |
The calculated statistical parameters are shown here. Note that both the variance and standard distribution have been calculated with the sample method (in contrast to population).